A Comprehensive Look at Bearer Assets - Part 3
Pricing Dynamics of Gold and Bitcoin
In the long run, fiat currency tends to lose value, while it generally remains stable in the short term. On the other hand, alternative assets like gold and bitcoin tend to exhibit greater volatility in the short term but have historically maintained or increased their value over the long term.As a result of this volatility, there are bull (favorable) and bear (unfavorable) markets for gold and bitcoin. This is understandable since there are circumstances in which fiat currency remains relatively robust, while in other situations, fiat currency experiences devaluation.Investors can rely on certain reliable indicators to assess these different environments. It is important to analyze gold and bitcoin separately as they operate differently in terms of pricing dynamics thus far.Pricing of Gold
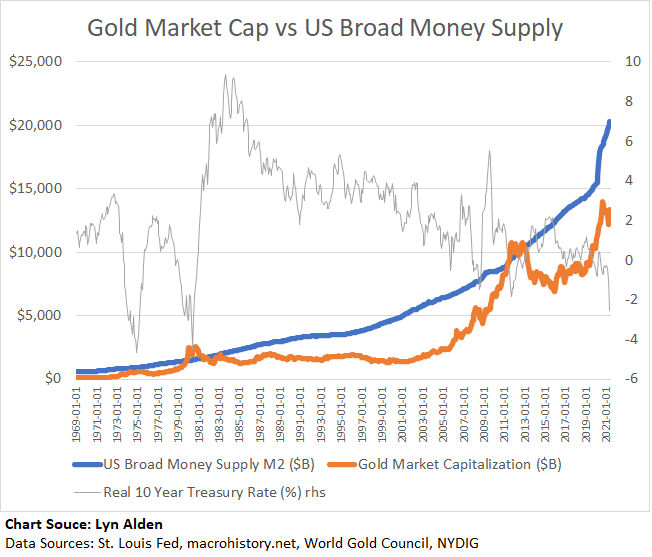
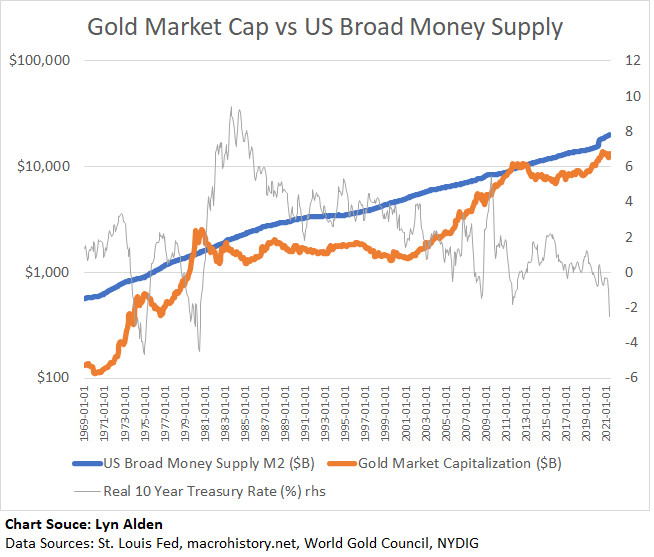
Gold primarily functions as a risk-off asset. Its long-term performance shows a correlation with the growth of broad money supply, while its intermediate-term performance is more correlated (inversely) with inflation-adjusted interest rates.To illustrate, let's consider the recent history of the gold price (represented in red) compared to real 10-year Treasury rates.Chart Source: St. Louis FedGold is an asset that doesn't yield any interest and entails some costs, but its supply is limited and changes slowly. When real rates on currencies and government bonds are decreasing, particularly when they turn negative, gold becomes more attractive compared to fiat currency. Conversely, when real rates are significantly positive, gold tends to be less favored.This reasoning is logical. If a 10-year Treasury bond offers a 7% annual yield while inflation stands at 3%, the real rate of return is 4%. In such a scenario, the high opportunity cost of earning a strongly positive real yield with Treasuries makes gold less appealing.On the other hand, if the 10-year Treasury bond provides a 2% annual yield while inflation reaches 4%, the real rate of return becomes -2%. In this situation, gold becomes significantly more attractive as the opportunity cost is negative. Thus, gold becomes both scarce and ironically higher-yielding in such an environment.In this sense, gold is not solely an inflation hedge; it serves as a hedge against negative real yields. However, it is worth noting that in practice, the deepest negative real yields often occur during periods of high and rapidly rising inflation.However, while real interest rates can provide insight into the direction of gold's value, they don't offer much information about the magnitude of its valuation. This presents the longstanding challenge of evaluating a non-cashflow or money-like asset.Many people compare the price of gold to the growth of broad money, but they often overlook the fact that gold itself has an inflation rate, albeit a low one. The above-ground supply of gold increases by slightly over 1.5% per year on average in the long run due to mining activities. It is crucial to consider this factor when comparing gold to fiat money supplies. A research piece by NYDIG in November 2020 offered a useful chart illustrating gold's annual new supply rate.Chart Source: NYDIGAdditionally, there is an annual chart with data spanning over a century that depicts the estimated global gold market capitalization in comparison to the US broad money supply.The chart reveals periods when gold was relatively cheap based on this ratio. In the 1950s and 1960s, this was due to government suppression of gold through the gold peg. However, this arrangement broke in 1971, leading to a substantial revaluation of gold to reach a market clearing rate. Similarly, during the late 1990s and early 2000s, there was a significant bear market in commodities, causing gold to become unusually cheap for several years.On the other hand, certain periods on the chart represented bubbles. In 1934, the US government devalued the gold peg, resulting in a sudden 70% increase in the price of gold in dollar terms. In the late 1970s, amidst high inflation and real interest rates as low as -5%, gold experienced an extreme price surge. In 2011, following the global financial crisis, the introduction of quantitative easing, and real 10-year interest rates reaching nearly -2%, gold entered its third bubble.Here is a monthly version of the chart, providing a more detailed view of gold's price during the five decades of its relatively free-floating period. Moving on, this chart presents a breakdown of gold market capitalization and US money supply, displaying them separately in absolute terms.Lastly, here is the logarithmic version of the previous chart, offering a clearer depiction of gold's tendency to experience significant increases when interest rates become deeply negative.Pricing of Bitcoin
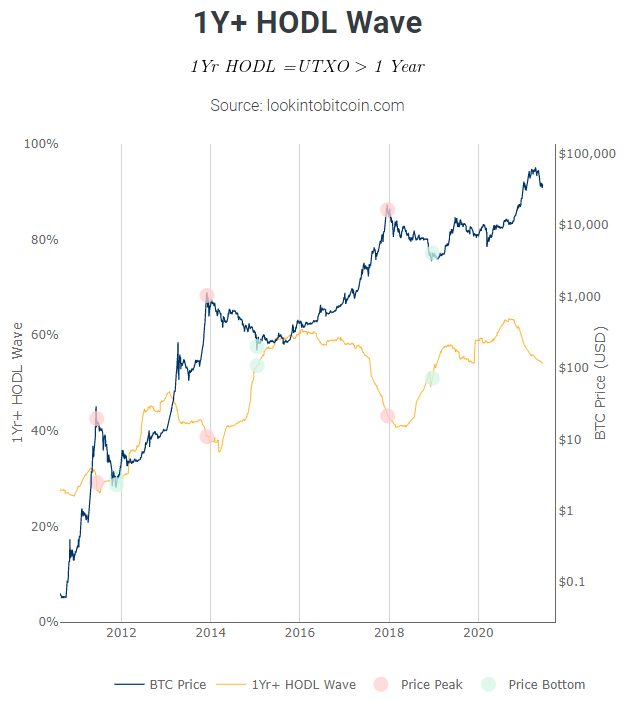
Bitcoin presents more challenges as it is a newer asset with a smaller market capitalization and higher volatility compared to gold. Unlike gold, it tends to be perceived as a risk-on asset more frequently.Currently, the most significant correlation observed with bitcoin is its own supply cycle. Every four years, the algorithm reduces the number of new coins generated in a 10-minute interval, leading to a "post-halving" bull run. The following chart displays the logarithmic form of bitcoin's price, highlighting the halving points.Chart Source: Blockchain.comAnalyzing on-chain data reveals that the percentage of bitcoin held by long-term holders typically decreases during bull markets and increases during bear markets. This indicates significant distribution cycles within the protocol.Chart Source: Look Into BitcoinThe Bitcoin network is essentially witnessing real-time monetization. It achieved a $1 trillion market capitalization at an impressive speed and reached an estimated 100 million users in fewer years than the internet took from its launch.The market is actively attempting to assess the Bitcoin network's total addressable market, similar to evaluating a growth stock. However, this evaluation also considers various risks, including the dilution of network effects from competing cryptocurrencies, the potential for government bans, and security concerns ranging from the declining block subsidy to the potential impact of quantum computing as a tail risk.What is the potential total addressable market for Bitcoin? Could it be just 10% of gold's market capitalization, already reached and trending downward towards irrelevance due to constant competition in each bull cycle? Or could it be 50% or even 100%? Is there a possibility that it could eventually surpass gold's market capitalization by 200% or 300%+? One argument is that being digitally native, Bitcoin is easier to access and build upon with secondary layers and various applications. Additionally, it has been recognized as legal tender in some regions.The ultimate answer to these questions is currently unknown, which contributes to the high volatility of Bitcoin. Instead of categorizing it solely as a store of value, it can be described as an emerging store of value. Based on on-chain data and exchange data, it is estimated that approximately 2-3% of people globally own or have owned Bitcoin. It is a project that has been successful over its 12.5-year existence but still faces significant challenges and risks. The market is attempting to assess the probability of its success and define what success would actually entail.Similar to other risk-on assets, Bitcoin's performance is closely linked to liquidity. When real interest rates are high or liquidity shocks occur, Bitcoin tends to experience crashes. Conversely, when liquidity is abundant and broad money supply grows rapidly, Bitcoin tends to perform well. However, these dynamics are influenced by the broader cycle of Bitcoin's supply creation, overall network effect, and user adoption.Concluding Remarks
This piece aims to provide insight into why bearer assets like gold and bitcoin hold value for a significant portion of the population. There are individuals who prefer to take custody of money-like assets that are resistant to devaluation. The extent to which people feel this way generally depends on the political and economic conditions in their region, particularly the performance of their local fiat currency in terms of maintaining positive real interest rates and stable purchasing power. To truly understand this perspective, it may be necessary to empathize and put ourselves in someone else's shoes to grasp their experiences.Furthermore, Bitcoin introduces the potential for permissionless local and international payments and serves as an internet-native currency for micropayments and other use cases. It also enables the development of user-friendly applications that provide basic banking services to unbanked populations. The Bitcoin ecosystem is continually evolving, and it is challenging to predict how it will shape up in the next 5-10 years. 


